I wanted a good temperature dataset for a project I could build on, eventually incorporating changing energy prices in a dynamic geopolitical situation. Cyprus interested me because of its demand for air conditioning and dependence on imported energy. In 2024, net imports supplied 88% of its energy needs, while cooling accounted for 16% of household energy use, which is the highest share in the EU. I started with NOAA’s nearly complete daily temperature record for Larnaca from 1978 through 2024 to examine how temperatures have changed.
Where the observations come from
The daily temperatures come from NOAA’s Larnaca station on the coast of Cyprus. Click the marker for station details, or zoom in to explore its surroundings.
I used 1978 through 2024 because the 1977 record has large gaps and the saved dataset ends partway through 2025. Only 17 of 17,167 days were missing during the selected period. I kept all 47 years and calculated each annual average from the available daily readings.
NOAA daily data · Data definitions · Station metadata · Analysis notebook
How temperatures have changed
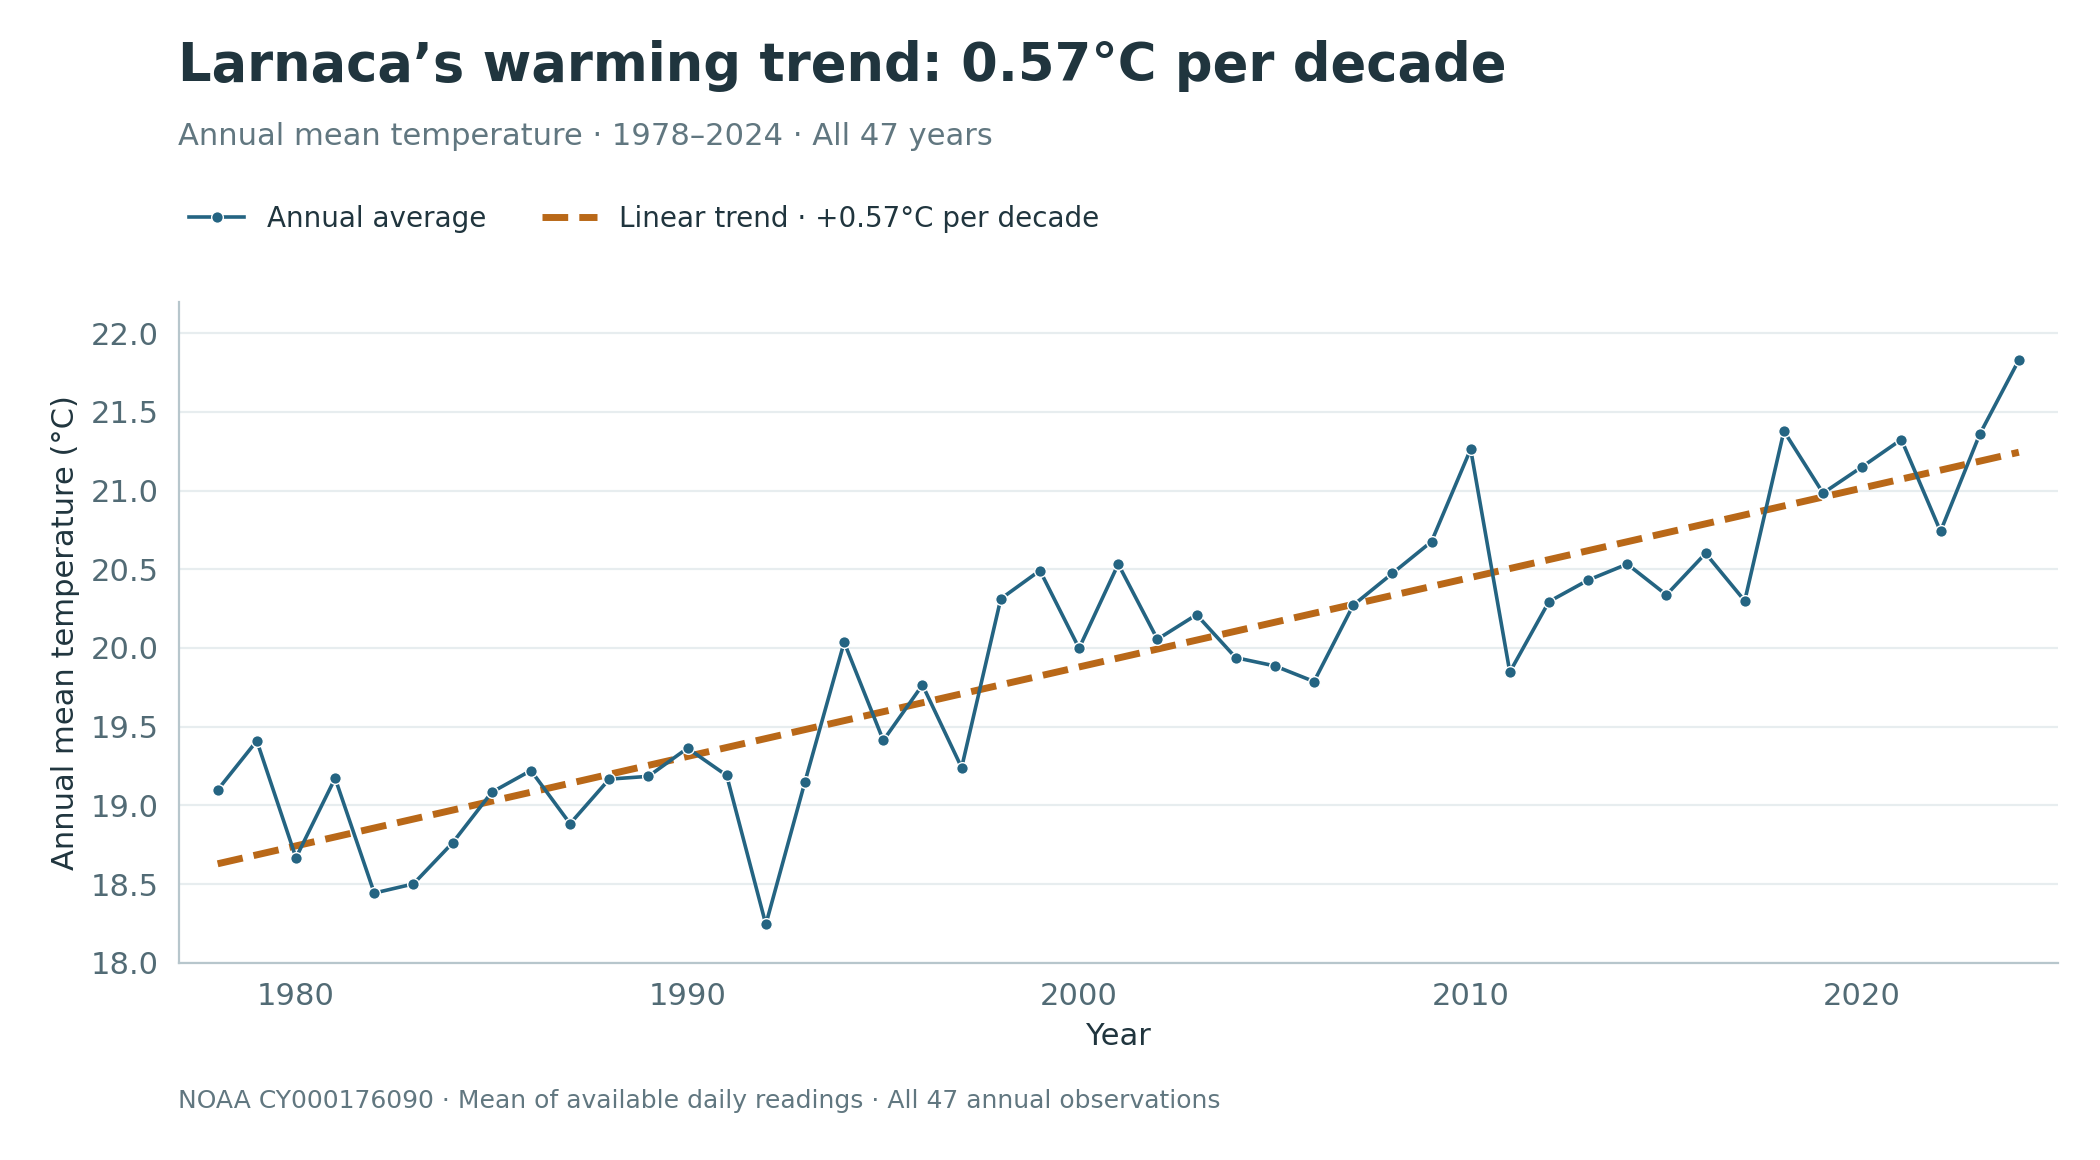
I estimated the warming trend using ordinary least squares (OLS) regression, with year predicting annual mean temperature. OLS fits a straight line by minimizing the sum of squared differences between observed and predicted temperatures. The estimated warming rate is 0.57°C per decade, equal to about 2.6°C between 1978 and 2024.
Download the chart · Annual data
| Data used | Years included | OLS warming estimate |
|---|---|---|
| All years, 1978–2024 | 47 | 0.57°C per decade |
| Years with no missing days, 1978–2023 | 41 | 0.55°C per decade |
Excluding the six years with missing days changed the warming estimate from 0.57°C to 0.55°C per decade. I kept all 47 years in the main analysis because dropping nearly complete years removed useful data with little effect on the estimated trend.
This result only describes one station in Larnaca. Comparing records from nearby stations such as Nicosia (Athalassa), Akrotiri, and Paphos, and checking for changes in station location, equipment, or surrounding development, would help determine how well it represents warming across Cyprus.
I want to build on this analysis by combining daily temperatures with electricity prices and household energy use. That would help show how changes in demand for air conditioning and changes in energy prices combine to affect household costs.